Practice data handling and presentation with Class 6 worksheets. Learn data collection, design, and limitations while creating bar graphs, pictographs, and other visual representations.
10Workbooks
Filters
Filters
Sort By
Recently Added
Most Recommanded
A to Z
Filters
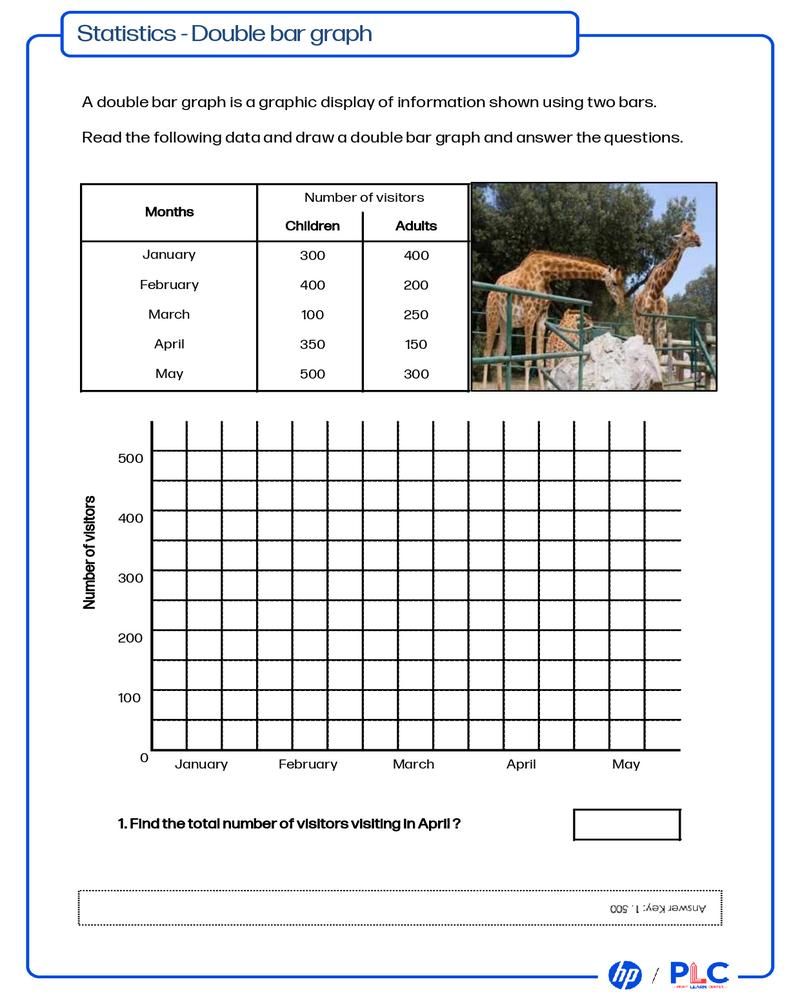
Double Bar graphs, Histograms, Pictograms, and Line graphs
Practice data representation with these comprehensive statistics worksheets. Learn to create and interpret double bar graphs, histograms, pictograms, and line graphs.
5Worksheets
50MINS
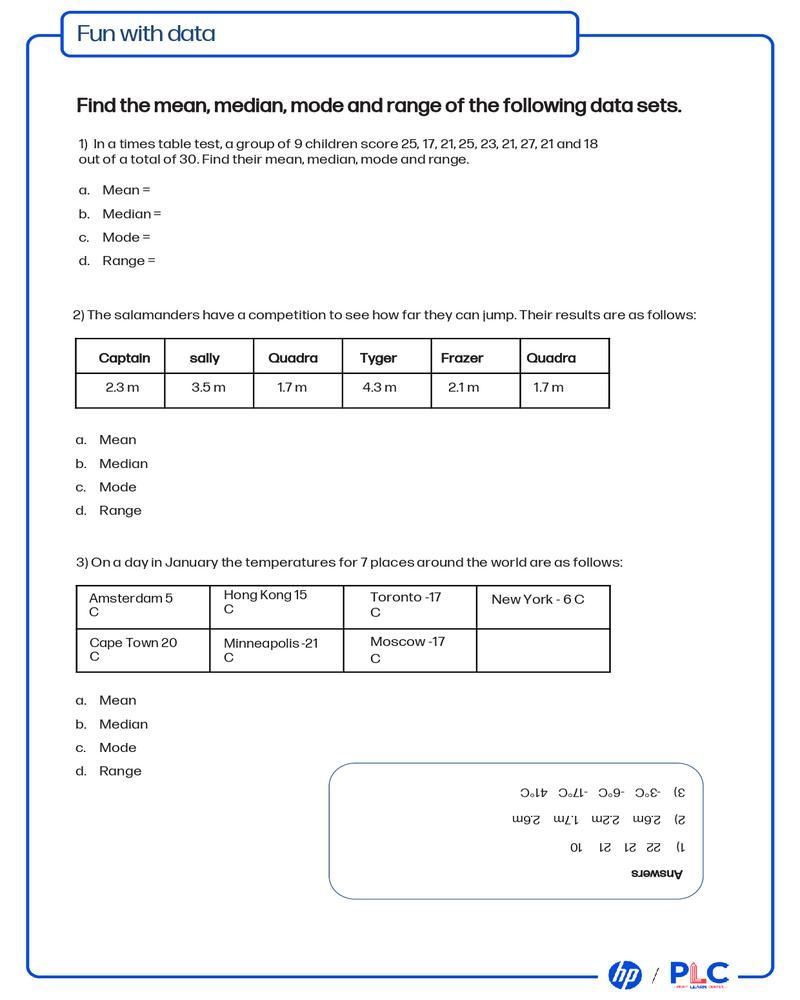
Mean, Median, Mode, Range & Graph Analysis
Practice data analysis fundamentals - mean, median, mode, range along with interpreting bar/pictographs, and solving engaging word problems on time, ages, and savings.
4Worksheets
40MINS
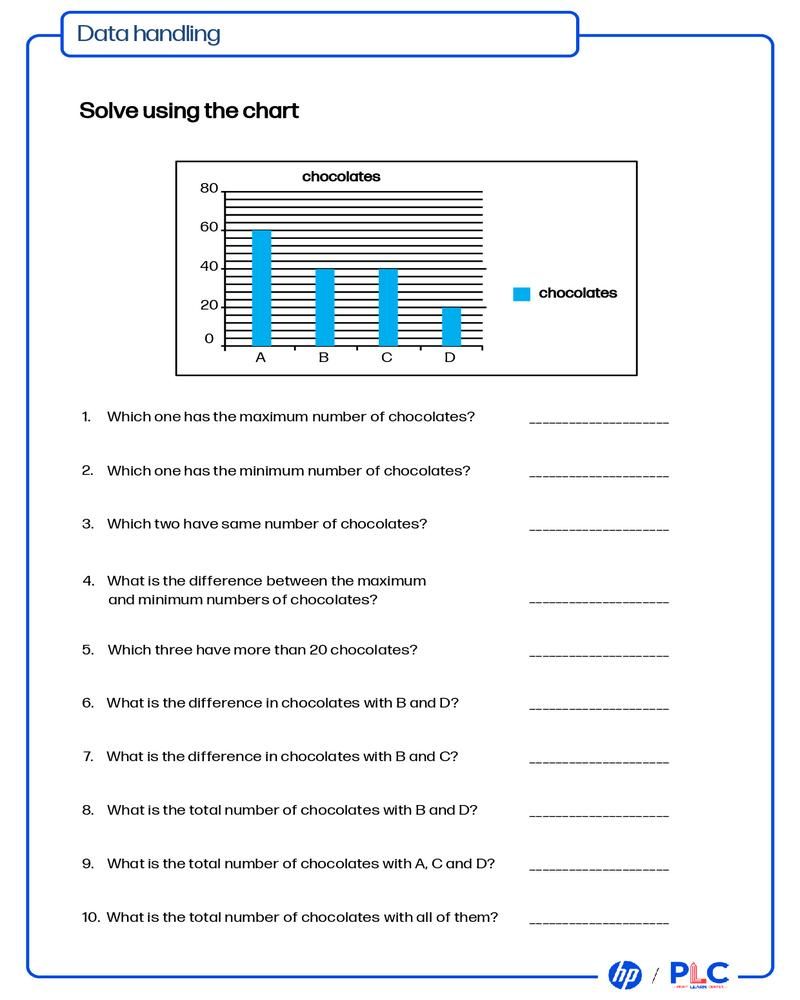
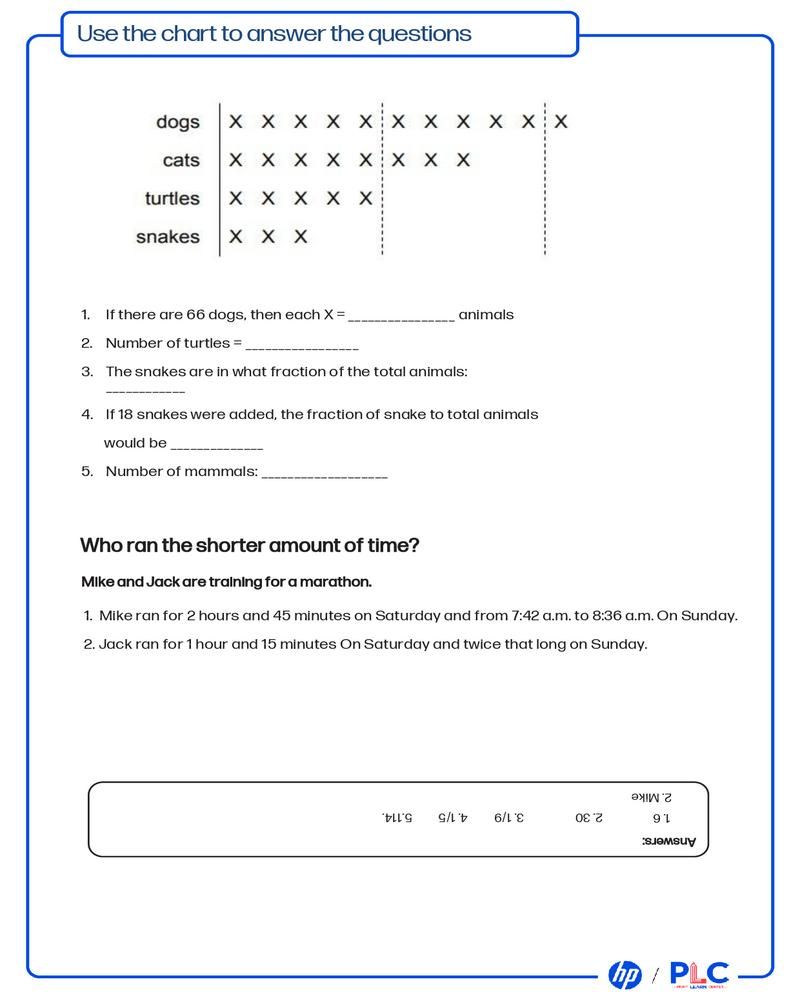
Data Handling - Analyze Charts & Tables
Develop essential data analysis skills with these engaging math worksheets. Learn to read and interpret data from charts and tables, improving your understanding of statistics and problem-solving.
3Worksheets
30MINS
Interpreting Pictographs & Solving Capacity Word Problems
Master pictograph interpretation and solve capacity problems involving liters and milliliters with this comprehensive worksheet for Class 6 students.
3Worksheets
30MINS
Graph Analysis & Algebra Word Problems
This worksheet provides comprehensive math practice with a variety of algebra word problems. Analyze data from a chart, solve age-related questions, and calculate money savings to build strong problem-solving skills.
3Worksheets
30MINS
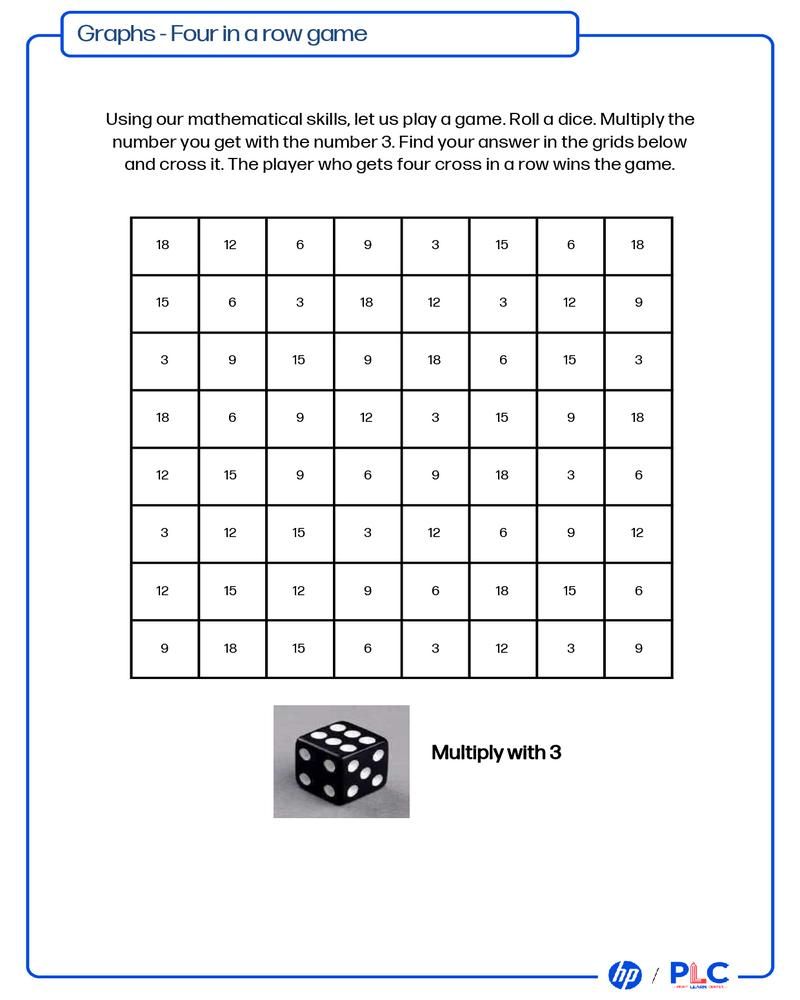
Magic Triangles, Distance-Time, and Multiplication Word Problems
This comprehensive worksheet for class 6 features math puzzles, real-world word problems involving distance, time, and money, and multiplication exercises.
3Worksheets
30MINS
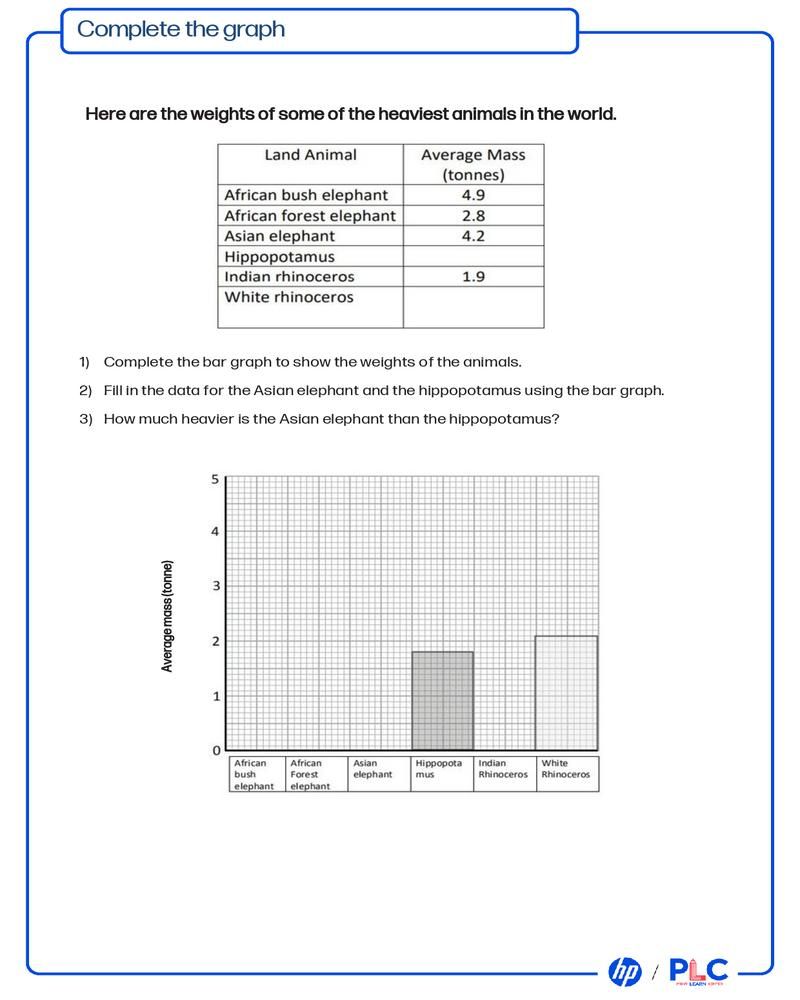
Complete the Graph - Practice Reading & Analyzing Bar Graphs
Enhance your child's data interpretation skills by completing, reading, and analyzing bar graphs. Perfect for Class 6 students to identify trends and understanding graphical data representation.
2Worksheets
20MINS
Plotting Coordinates & Graphing Shapes
Learn to plot coordinates on a graph by connecting a series of points on the x and y axis. This hands-on activity will help your kid in class 6 to master coordinate graphing.
2Worksheets
20MINS
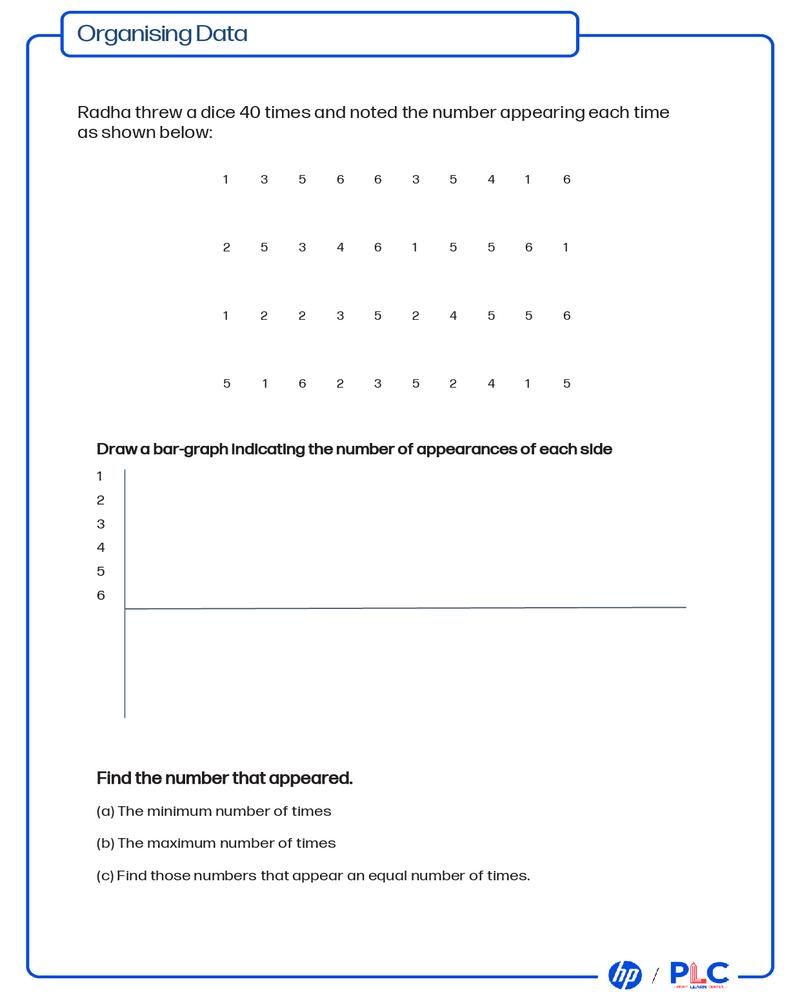
Organizing Data - Create Bar Graphs & Frequency Tables
These worksheets are designed for class 6 students to practice fundamentals of data organization by creating frequency tables and bar graphs.
2Worksheets
20MINS
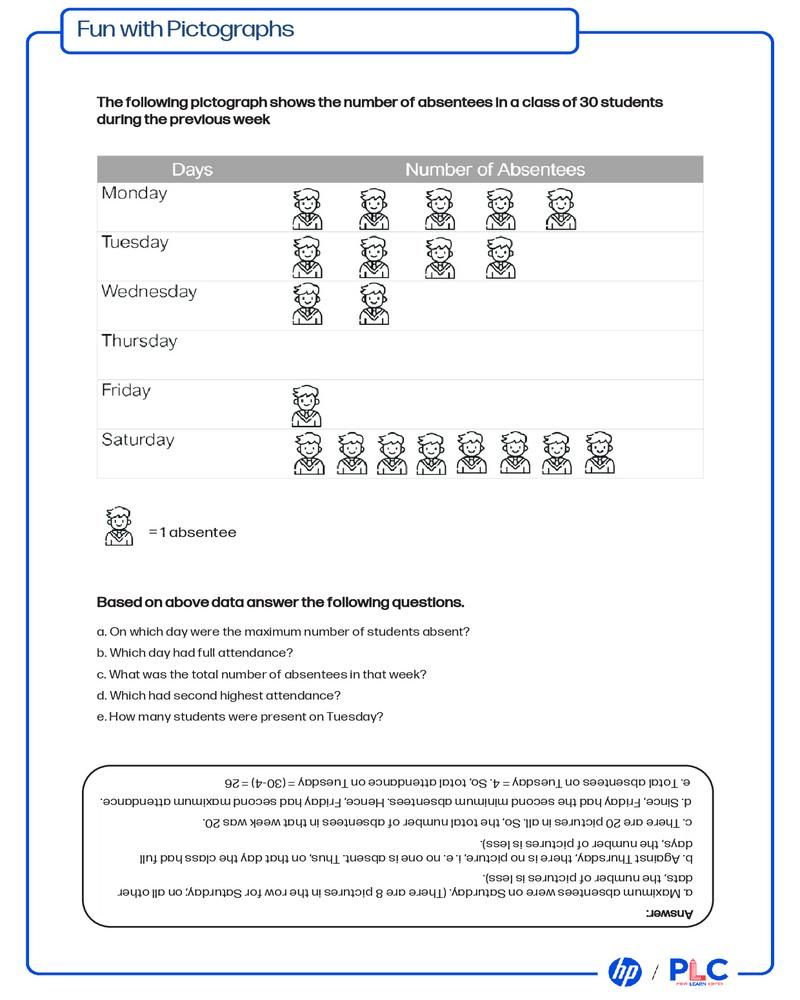
Interpreting Pictographs
This worksheet helps class 6 students practice interpreting and analyzing pictographs to answer questions about data.